Detecting memory leak in Java using JConsole with example code
In this post, we will see example code of memory leak in Java. Afterward, we will connect the Java application to JConsole to compare the memory usage of the application with and without memory leaks. The deep dive into the memory monitoring tool of JConsole will allow us to see how the Heap memory is divided into different spaces and how the Garbage collector efficiently manages the memory of the Java Application.
Garbage Collection in Java
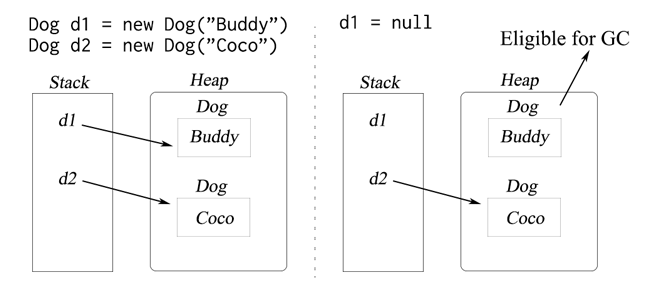
In Java, the Garbage Collector (GC) is responsible for freeing up the memory utilized by unused objects. Any object that doesn’t have a reference to it is eligible for Garbage collection as seen in the image below. The Reference to a Dog object – Buddy is set to null in the second part of the image hence it becomes eligible for GC.
What is a Memory Leak in Java
A memory leak is caused when the program fails to release unused memory which can lead to either unexpected results or application crash. Even though there is no official definition of a memory leak in Java we can broadly divide it into two categories for ease of understanding.
- Memory leaks caused by objects that are unreachable from running code.
- Memory leaks caused by objects that are reachable from running code but won’t be used again.
The first kind of memory leak occurs when the reference to the object is no longer present in the running code but the Garbage Collector is still not able to free up space for these objects. An example code of this is posted here.
The second kind of memory leak is mostly due to faulty logic in the program where the reference to unused objects is kept in the running code (even though the object will never be used again) which doesn’t allow the GC to reclaim the memory. Some developer considers this leak as, not an “actual memory leak” because setting the reference to null would allow GC to reclaim the memory. However, if the code is already deployed there is no way to set the reference of unused objects to null. In the following section, we will consider the example of this kind of leak.
Example of Memory Leak in a Java Program
Let’s consider a real-life example of a Dog Shelter where Dogs are added to the shelter and removed from the shelter when they are adopted. The complete example is hosted on Github.
The Dog.java class has three variables described below.
- microchip ID – uniquely identifies the dog.
- name – an optional variable representing the name of the dog.
- byte array – to expedite the memory leak we have a byte array of 10Mb.
| /** The Unique MicroChip ID of the dog. */ | |
| private int microChipID; | |
| /** The name of the dog. */ | |
| private String name; | |
| /** Extra memory space for each instance to speed up the memory leak. */ | |
| private byte[] toExpediteLeak; |
Below is the problematic piece of code which can lead to a memory leak. In the overridden equals method we are comparing two Dog objects by equating the microchip ID and the dog name. Since the name of the dog can change, using it to equate two Dog objects can lead to unexpected results. For instance, deleting the Dog object stored in a HashSet would fail if the Dog object is stored with the old name and we try to remove it using the new name.
| @Override | |
| public boolean equals(Object obj) { | |
| if (obj == this) | |
| return true; | |
| if (!(obj instanceof Dog)) | |
| return false; | |
| Dog dog = (Dog) obj; | |
| return dog.microChipID == microChipID && dog.name.equals(name); | |
| } |
The DogShelter.java class is responsible for maintaining the list of Dogs currently present in the shelter in a HashSet as seen below.
| /** In Memory Store containing the dogs present in the shelter. */ | |
| private Set<Dog> shelterDogs = new HashSet<Dog>(); |
The class exposes two public methods that can be used to Add and Remove Dogs in the shelter.
| public void addEntry(int microChipID, String name) { | |
| Dog dog = new Dog(microChipID, name); | |
| shelterDogs.add(dog); | |
| } |
| public void removeEntry(int microChipID) { | |
| Dog dog = new Dog(microChipID); | |
| shelterDogs.remove(dog); | |
| } |
Notice we are adding the dog object using the Microchip ID and name whereas we are removing the Dog object just using just the Microchip ID. However, to actually remove the Dog Object from the Set we need to provide both the Microchip ID and the name of the dog due to the faulty logic used in overriding the equals method.
Finally, to trigger the memory leak we will serially add and remove Dog objects in the HashSet.
| public void addAndRemoveRandomEntries(int entriesCount) { | |
| Random rand = new Random(); | |
| String[] commonDogNames = { "Buddy", "Coco", "Charlie", "Cooper", "Maggie" }; | |
| for (int i = 0; i <= entriesCount; i++) { | |
| /** Generate a random dog name from the list of common dog names. */ | |
| String randomDogName = commonDogNames[rand.nextInt(commonDogNames.length)]; | |
| /** First add and then remove the entry from the HashSet. */ | |
| addEntry(i, randomDogName); | |
| removeEntry(i); | |
| System.out.printf("Successfuly removed entry for %s with unique id %d.\n", randomDogName, i); | |
| try { | |
| /** | |
| * Sleep before adding & removing new entry so that we can see the memory grow | |
| * in JConsole. | |
| */ | |
| Thread.sleep(500); | |
| } catch (InterruptedException e) { | |
| e.printStackTrace(); | |
| } | |
| } | |
| } |
Let’s run the main method and see how our program crashes with OutOfMemoryError in a matter of seconds.
| public static void main(String[] args) { | |
| DogShelter shelter = new DogShelter(); | |
| shelter.addAndRemoveRandomEntries(1000); | |
| } |
How to monitor the memory usage of Java Application using JConsole
After running the main method open JConsole and connect it to the local Java Process. If you are unfamiliar with the steps you can follow this tutorial.
After connecting JConsole to your local Java Process, if you click on the Memory tab you will see the Window as seen below. Let’s discuss each feature of the Memory Tool in depth.
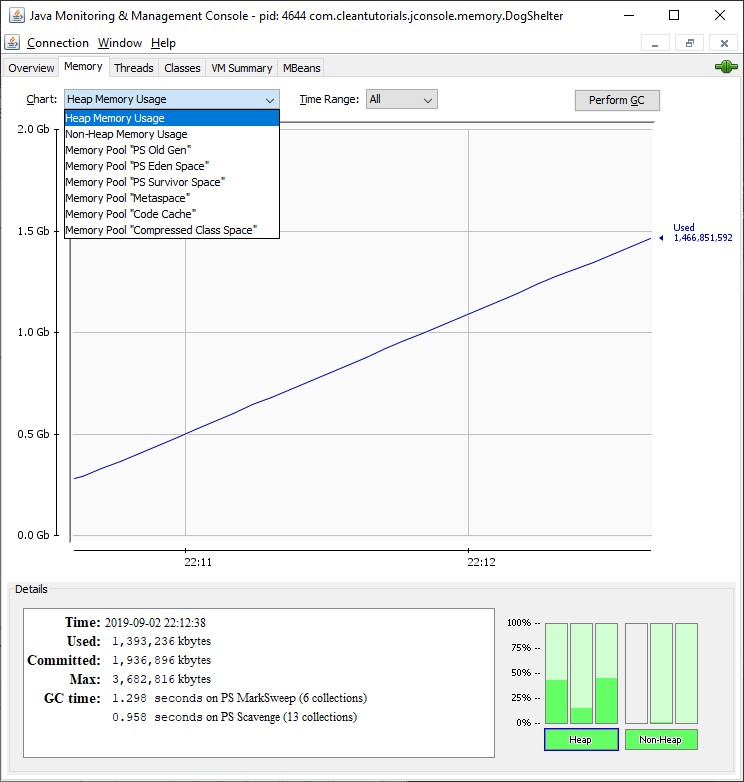
Heap V/s Non-Heap Space
In the lower right corner of the JConsole window, we can see several bars representing the current memory usage percentage. The memory space is divided into Heap space and Non-Heap Space.
Heap Space
The objects that you create using the new keyword land up in the Heap space. In a typical Java Program, since new objects are continuously created and deleted we need a mechanism to recover the memory of the unused objects. The Garbage Collector is responsible for actually freeing up the memory of these unused objects and to do this process efficiently the heap memory is divided into 3 different spaces.
- Eden Space – The newly created objects are present in the Eden space.
- Survivor Space – The objects in Eden Space that survive garbage collection are promoted to Survivor Space.
- Old Gen – The objects that survive Garbage Collection in Survivor Space for a long time are promoted to Old Gen or Tenured Generation.
The GC runs less frequently for the old Gen space as the long-living objects live in the space. Whereas the GC is run more frequently on the Eden space as new objects are more likely to be dereferenced. This segregation of heap memory allows for efficient memory management.
Non-Heap Space
The Non-Heap space is divided into the Metaspace, Code Cache and Compressed Class Space.
Metaspace stores the metadata describing user classes. So all the class related data like the Static method and primitive type variables are stored here. Prior to Java 8, PermGen was used instead of Metaspace. The Metaspace has the following advantages over PermGen
- The Metaspace uses native memory instead of using the Heap as in PermGen.
- The Metaspace is not of fixed size anymore, it auto increases up to a certain limit (which can be specified using JVM Parameters). Whereas PermGen is fixed in size.
- Garbage collection is triggered to remove the unused class definitions and loaders when the memory reaches the MaxMetaspaceSize.
Code Cache space is used to store the native machine code for faster execution of Java Program by the Just-In-Time (JIT) Compiler.
Understanding the JConsole Memory Charts
At the top section of the JConsole Window, you can see there are multiple Memory charts. Let’s analyze all the heap memory charts and compare the memory usage in a Java application with and without memory leak. It’s important to note that the memory chart patterns shown below are specific to this particular Java application.
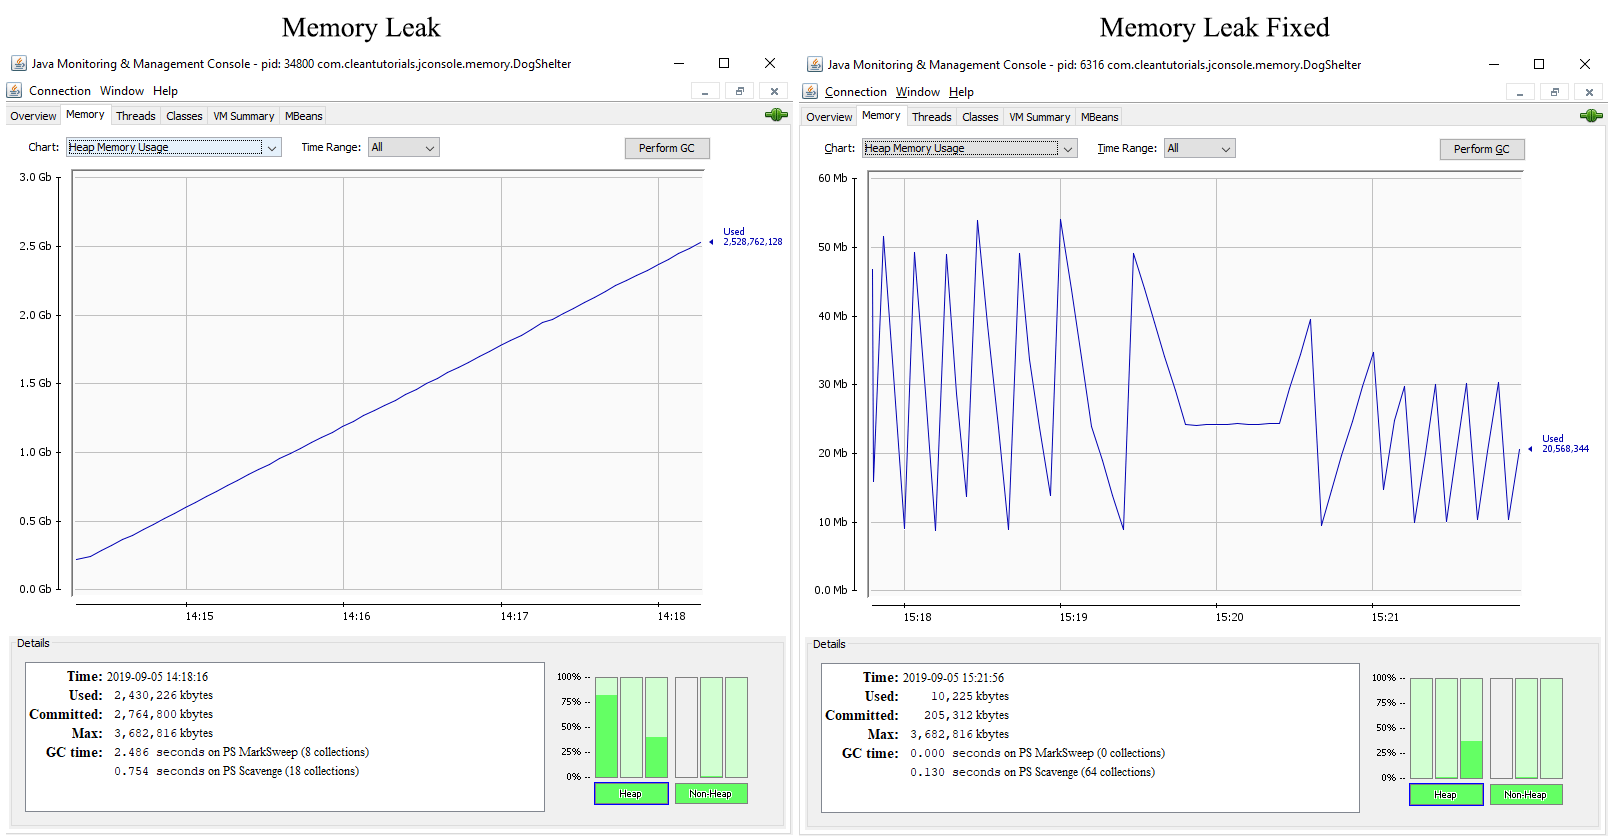
Heap Memory Chart
The heap memory chart shows the combined memory utilized in the Eden Space, Survivor space and the Old Gen space. The heap memory chart itself is sufficient to monitor the memory of your Java application and possibly detect a memory leak.
Memory Leak
- The heap memory keeps on growing continuously as the operation with memory leak is repeated in the program execution.
- If the operation with memory leak is repeated multiple time the program will eventually crash with OutOfMemoryError.
Memory Leak Fixed
- The heap memory usage goes up as the operation is repeated multiple times and once GC has triggered the memory utilized by the unused object is reclaimed.
- If the exact same operation is repeated multiple times, we can see that after the GC cycle completes the memory usage lands up at almost the same place (~10 Mb).
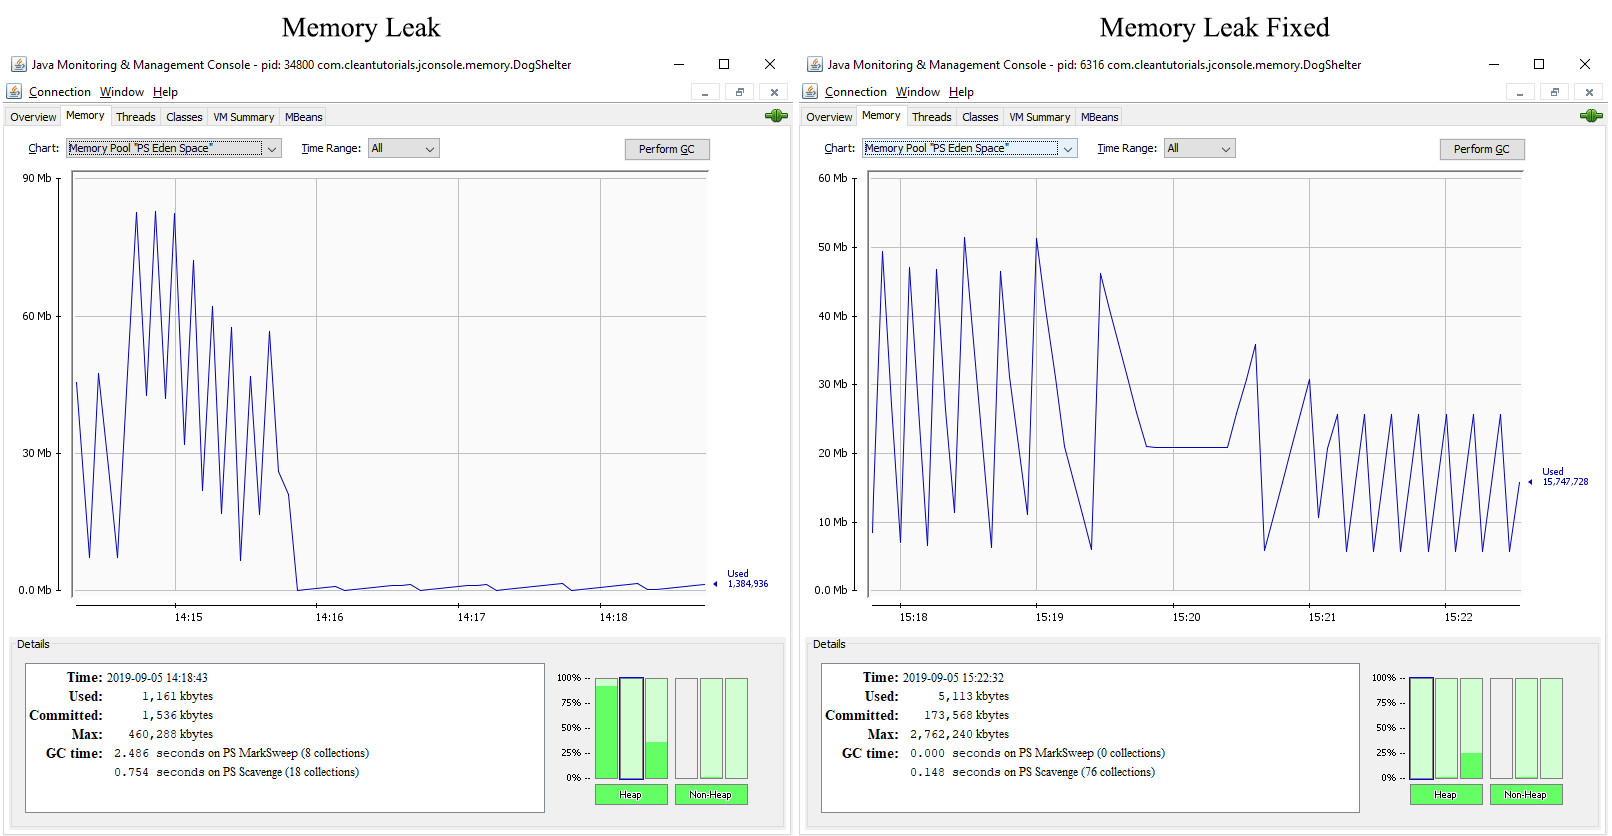
PS Eden Space Chart
Memory Leak
- Till the time 14:16 new Dog objects are allocated memory from the Eden Space.
- Interestingly, after 14:16 the new Dog objects are allocated memory directly from Old Gen Space as we will see in the next section.
- A possible explanation for this behavior is that the JVM identifies all the Dog objects are landing up in the Old Gen Space after the GC Cycle completes. Hence, the JVM allocates memory directly from the Old Gen space skipping the process of transferring the object from Eden Space to Survivor Space and finally to Old Gen space.
Memory Leak Fixed
- The memory chart is almost the same as the heap memory chart because the Dog objects are created and the reference is removed immediately hence they are eligible for Garbage collection.
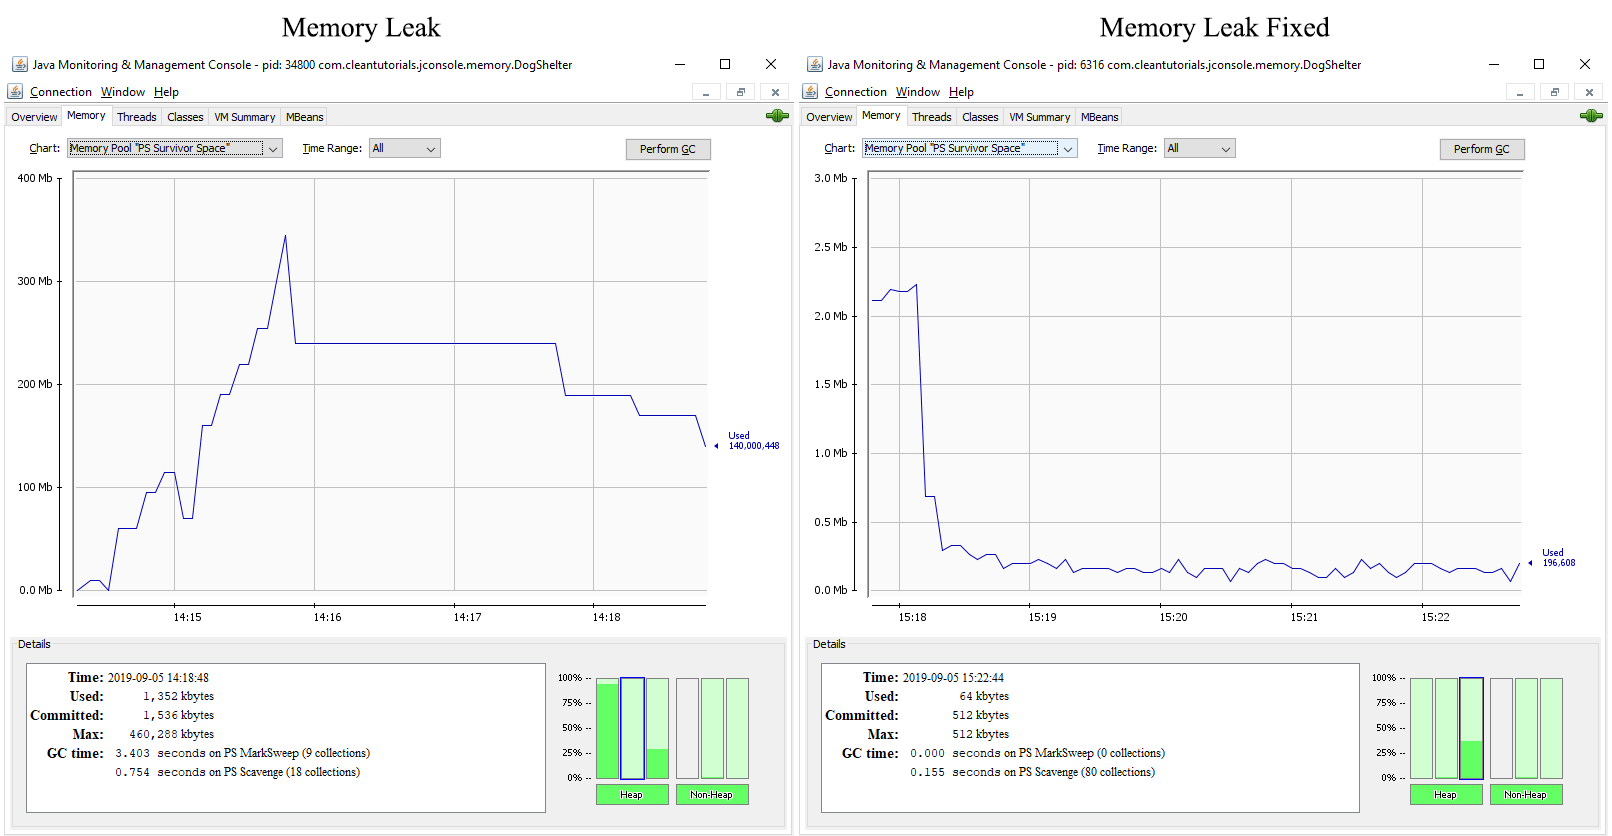
PS Survivor Space Chart
Memory Leak
- Till the time 14:16, the Dog objects that survived GC in the Eden Space are transferred to the Survivor Space.
- After 14:16 the Dog objects are allocated memory directly from the Old Gen Space hence the memory of Survivor Space declines.
Memory Leak Fixed
- GC reclaims the memory from the Eden space itself and hence Dog objects are not shifted to the Survivor space and we have almost constant memory usage.
PS Old Gen Space Chart
Memory Leak
- Till 14:16 we see step increase since the Dog objects are transferred from Eden Space to Survivor Space and finally to the Old Gen space.
- After 14:16 we see an almost constant rise in memory since the Dog objects are allocated memory directly from the Old Gen space.
- The memory reaches up to 2.6 GB.
Memory Leak Fixed
- Even though the memory chart looks similar to the one with the memory leak. However, we can see that the memory for Old Gen space has barely reached 6 MB.

In the next post, we will see a dirty hack to detect any major memory leaks in your Java application.


