Downloading JConsole and connecting it to a local Java process.
JConsole is a JMX compliant monitoring and management tool. It allows you to connect to a remote Java application or JVM and monitor it. JConsole provides a simple Graphical User Interface (GUI) with some limited but important features that make it easy to monitor your Java application. There is no support for accessing JConsole using the command line interface (CLI).
How to download JConsole?
Well, you cannot download JConsole separately. If you want to use JConsole you need to have Java SE Development Kit (JDK) installed on your system. Since JConsole is used mostly by developers, you may already have JDK installed on your machine. In case you don’t have the JDK, you can download it from the following link.
Here is the link to download Java SE Development Kit – Download JDK. The site will automatically detect the operating system that you are using – Windows, Mac or Linux and you can download the appropriate file.
How to run JConsole?
So you have downloaded the JDK. Now to open JConsole you can follow these simple steps.
- Navigate to the Java platform (JDK) installation folder. In the installation folder, open the bin folder. For instance, bin folder location on my Windows 10 machine is “C:\Program Files\Java\jdk1.8.0_131\bin”.
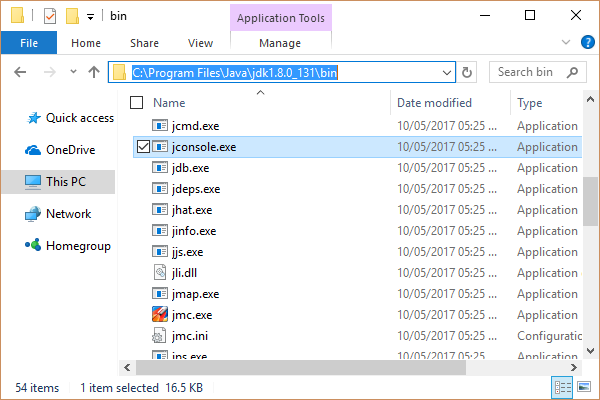
- Run the Jconsole.exe application to start JConsole.
- OR you can open the command prompt in the bin folder location and type “jconsole” and press enter which will open the JConsole window.
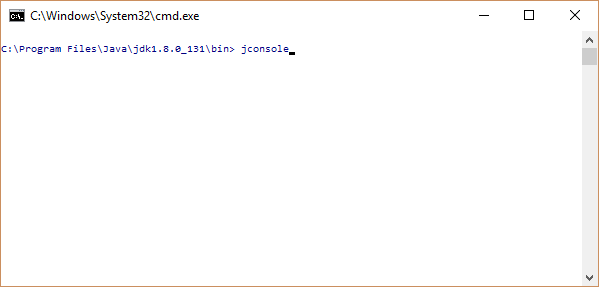
If the “path” environment variable is set to the bin folder of the JDK installation folder. You can start JConsole using the command prompt from any location and not necessarily go to the Java installation bin folder every time you want to open it using CLI.
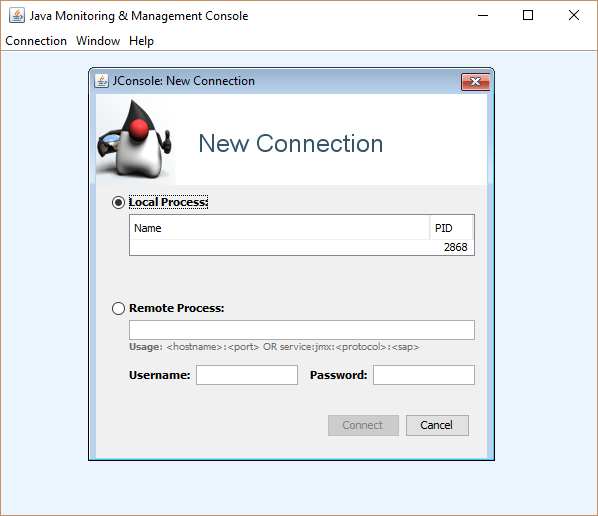
Connecting JConsole to a local process.
A process is local when the Remote management application i.e JConsole and the JVM (the java process) that you want to monitor are in the same system. Monitoring a local process is important during phases of development when you want to monitor certain resources or debug an issue. Connecting to a local process is simpler as compared to connecting to a remote process, which requires authentication and network communication.
Applications running with JRE System Library 6 or above.
You can run your program normally without entering any VM arguments to enable JMX.
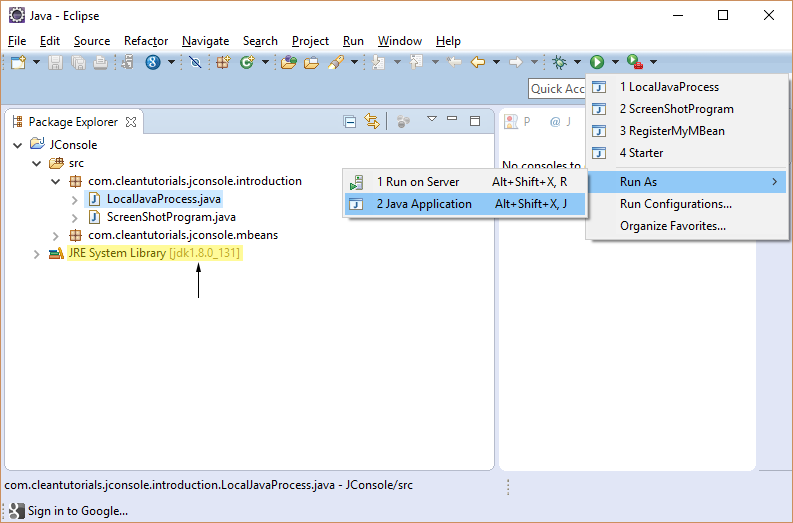
Here, LocalJavaProcess.java contains the main method and is executed using the Eclipse IDE without passing any VM or program arguments. The program is compiled and executed with JRE 8.
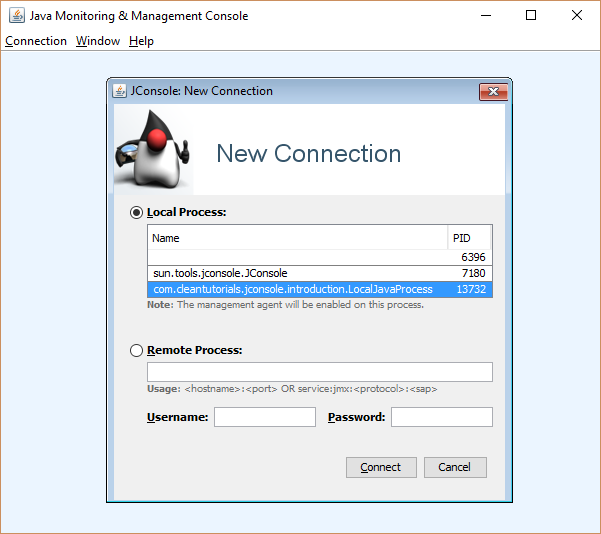
On starting JConsole, we can see that there are three Java processes running on the system. The first one is Eclipse, the second one is the JConsole instance itself and the third one is the Java application that we started using Eclipse. The process name will be visible as the fully qualified name of the Java class with the main function.
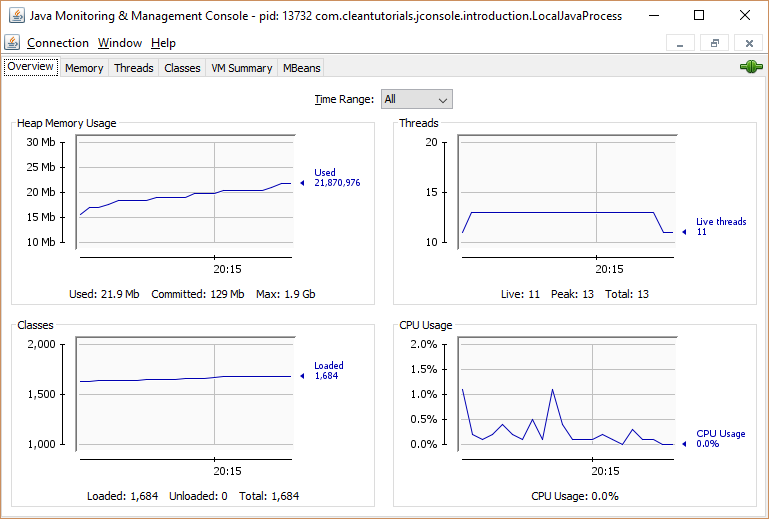
Clicking on the Connect button enables the JMX agent for that Java process and allows you to monitor the JVM.
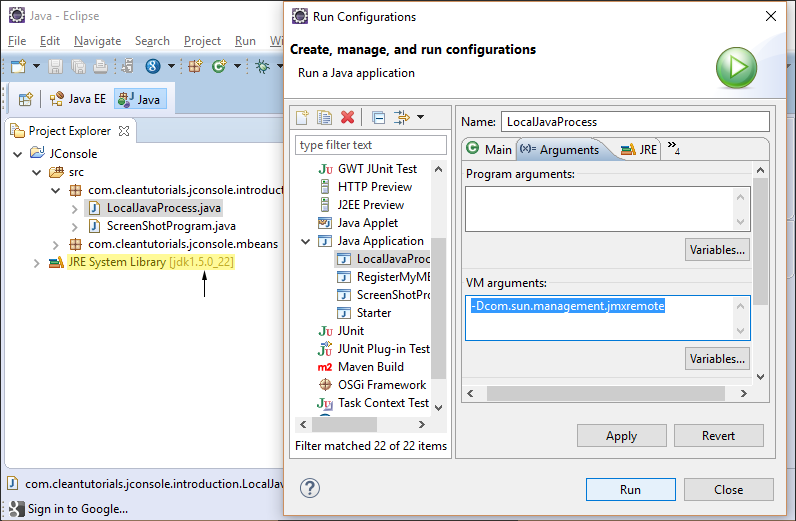
Applications running using JRE System Library 5 or below.
To enable JMX monitoring for these applications. You need to add the following VM argument “-Dcom.sun.management.jmxremote” when starting the application.
If you are using the command prompt to run your java program, you need to add the VM argument after java and before the class name. For instance to run the above program using the command prompt with JMX enabled (For JRE 5 or below), this command has to be used – “java -Dcom.sun.management.jmxremote com.cleantutorials.jconsole.introduction.LocalJavaProcess“.
If you try to run the application without this VM argument, JConsole will still list the Java Process in its list. But you will not be able to connect to it.
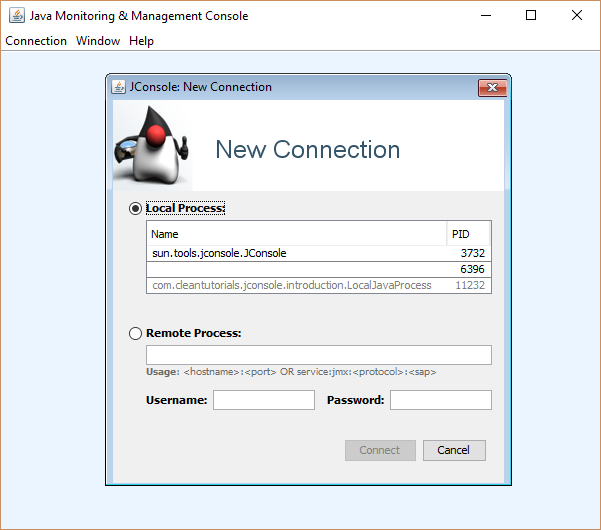
After starting the LocalJavaProcess application without the JMX VM argument with Java SE platform 5. The process even though visible in the list of Java process, cannot be monitored using JConsole. So make sure to add the above argument if you want to monitor it locally.


