Monitoring CPU Usage in Java using JConsole
JConsole provides CPU profiling feature using which we can monitor the overall percentage of the CPU Utilization by all the threads in your Java application under the CPU Usage section in the Overview tab. While you can utilize the CPU Usage section to get the overall CPU percentage of your Java application, it won’t tell you which thread in your application is responsible for the highest CPU usage. Luckily, we can use the Mbeans operations exposed in java.lang packages to get thread-level CPU usage and pinpoint the threads that are responsible for high CPU usage.
User Space vs Kernel Space in JConsole
Operations in a program can be performed in either kernel space and user space, kernel space operations consist of privileged operation like a write operation to a file on disk. Whereas user operations is a way to sandbox user process so that it doesn’t interfere with the underlying operating system resources. A program running in user space can perform operations in kernel space by using system calls. JConsole provides segregated metrics for the CPU time in kernel space and user space as we will explore below.
How to get the CPU Usage with JMX?
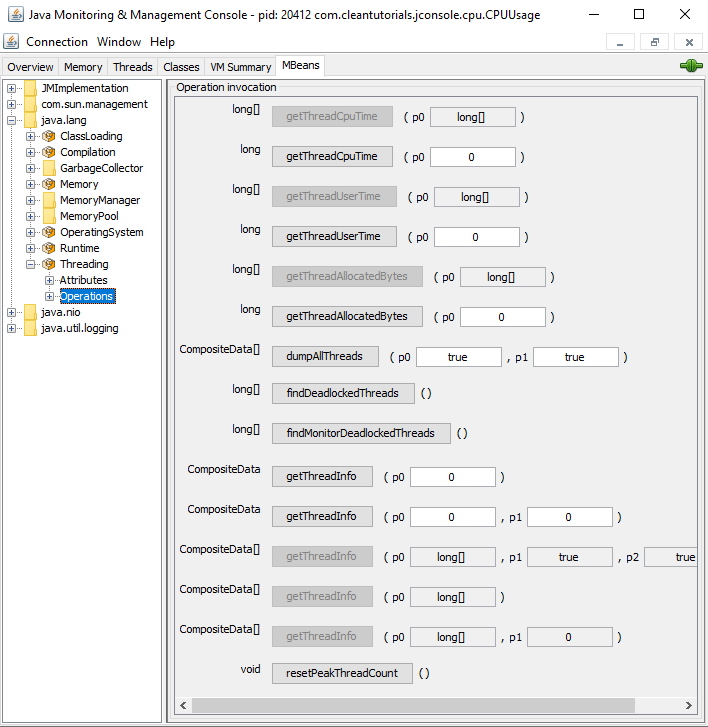
To utilize JMX and JConsole first you will have to connect your Java application to JConsole. We will use the MBeans tab to find per-thread CPU usage in the JVM. There are three main operations – dumpAllThreads, getThreadCPUTime, and getThreadUserTime that are present in the java.lang package’s Threading class that can be useful in finding per-thread CPU usage.
Example of High CPU Usage Thread
For ease of understanding, let’s consider an example that generates random numbers and appends it as CSV to a file on disk. The code for this example which demonstrates a thread with high CPU usage is hosted on Github.
| public void run() { | |
| File file = new File("random_numbers.txt"); | |
| Random rand = new Random(); | |
| try (BufferedWriter br = new BufferedWriter(new FileWriter(file))) { | |
| for (int i = 0; i < 10000000; i++) { | |
| // Contributes to the time executing calls in user space. | |
| String randomNumer = Integer.toString(rand.nextInt()); | |
| // Contributes to the time executing calls in kernel space. | |
| br.write(randomNumer + ","); | |
| // Flush the buffer. | |
| br.flush(); | |
| } | |
| } catch (Exception e) { | |
| e.printStackTrace(); | |
| } | |
| } |
The thread’s run method performs 3 operations which can roughly be segregated into user space and kernel space operations.
- Generates a random number which is executed in the user space
- The write operation performs the operation in kernel space like locking, writing to a file if the buffer is full, and also operation in user space like copying the content to the buffer if buffer has space.
- The third operation performs operation in kernel space by performing a write on the disk.
Now that we know what our thread does, let’s use the Mbeans to see how much CPU time our thread is consuming.
dumpAllThreads
The operation will dump the details of all the threads present in your Java Application. We want to find the Id of the thread for which we want to get the CPU Time.
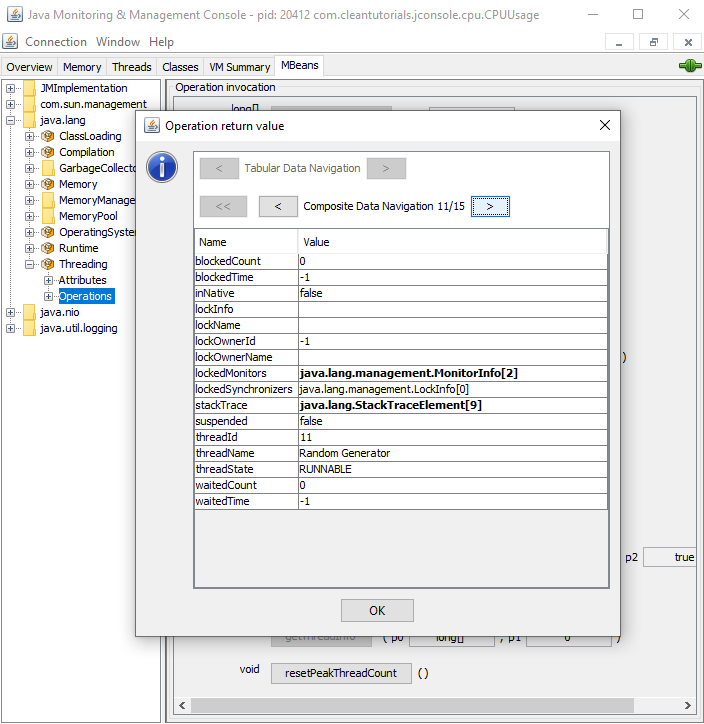
From the threadId column we find that our thread – Random Generator has an id equals to 11.
getThreadUserTime
getThreadUserTime takes the thread id as the parameter and gets the CPU time used in nanoseconds for all the operation in user space.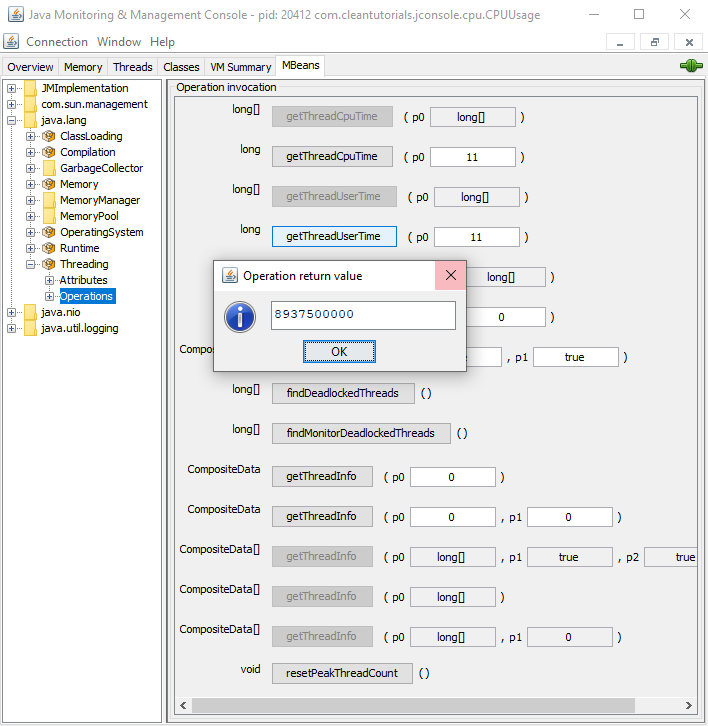
From the figure we can see that the thread utilized 8937500000 nanoseconds or approximately 9 seconds of CPU time in userspace.
getThreadCPUTime
getThreadCPUTime takes the thread id as the parameter and returns the CPU time used in nanoseconds for all the operations performed in user space and kernel space combined.
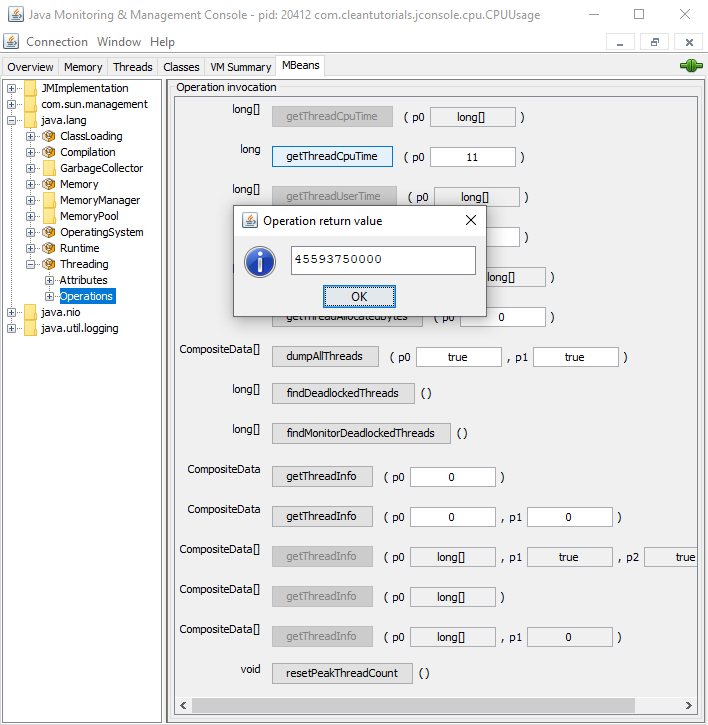
From the figure we can see that the thread used 45593750000 nanoseconds or approximately 45 seconds of CPU time.
How to fix High CPU Utilization?
One ad hoc approach that you can follow is by tweaking your program to improve efficiency and measuring the reduction in CPU time consumed by the thread for the same operation before and after you tweak your thread logic. Now let’s try to fix the high CPU usage with our random generator example. We know our thread took the most of the time in system mode i.e 45 – 9 ~ 36 seconds and it likely because we are flushing the buffer at the end of each loop iteration. Let’s try to run the program again without the buffer flush.
| br.flush(); |
After removing the line of code and monitoring the CPU time taken by the thread, getThreadUserTime returned 2000000000 nanoseconds i.e 2 seconds and the getThreadCPUTime returned 2218750000 nanoseconds i.e 2.2 seconds. This change reduced the CPU Utilization of our Java program by almost 95%.


