Heap dump analysis using Eclipse Memory Analyzer Tool (MAT)
A heap dump is a snapshot of all the Java objects that exist in the heap space. The heap dump file is usually stored with .hprof extension.
In this post, we will see how you can take the heap dump of your running Java application and use Eclipse’s Memory Analyzer (MAT) to identify memory hotspots and possibility detect memory leak.
Why and When should I take the Heap dump?
You may need to take the Heap dump if your Java application is taking up more memory than you expected or your Java application crashed with OutOfMemoryError. Analyzing the heap dump will lead us to the root cause of the anomaly.
Using the heap dump we can find details like the memory usage per class, number of objects per class, etc. We can also go into fine details and find out the amount of memory retained by a single Java object in the application. These details can help us pinpoint the actual code that is causing the memory leak issues.
How do you analyze very large Heap dumps?
Usually analyzing heap dump takes even more memory than the actual heap dump size and this may be problematic if you are trying to analyze heap dump from a large server on your development machine. For instance, a server may have crashed with a heap dump of size 24 GB and your local machine may only have 16 GB of memory. Therefore, tools like MAT, Jhat won’t be able to load the heap dump file. In this case, you should either analyze the heap dump on the same server machine which doesn’t have memory constraint or use live memory sampling tools provided by VisualVM.
How to take a Heap dump of your running Java Application
There are several ways to take a heap dump. We will talk about the 3 easiest ways to do it.
Command-line interface to generate the Heap Dump
These steps are common for all operating systems including Windows, Linux, and macOS.
- Find the process id of your running Java application. You can use the jps tool to list down all the running Java processes on your local machine. The processes will be listed in the following format “<pid> <MainClass>”
- After finding the pid, run the following command
This file contains bidirectional Unicode text that may be interpreted or compiled differently than what appears below. To review, open the file in an editor that reveals hidden Unicode characters. Learn more about bidirectional Unicode characters
jmap -dump:live,file=<file-name + .hprof> <pid>
The option live is important if you want to collect only the live objects i.e objects that still have a reference in the running code.
VisualVM to generate the Heap Dump
Visual VM makes it very easy to take a heap dump running on your local machine. The following steps can be used to generate heap dump using VisualVM
- Start Visual VM and connect your local Java Application to it.
- Under the Monitor Tab, click on Heap Dump.
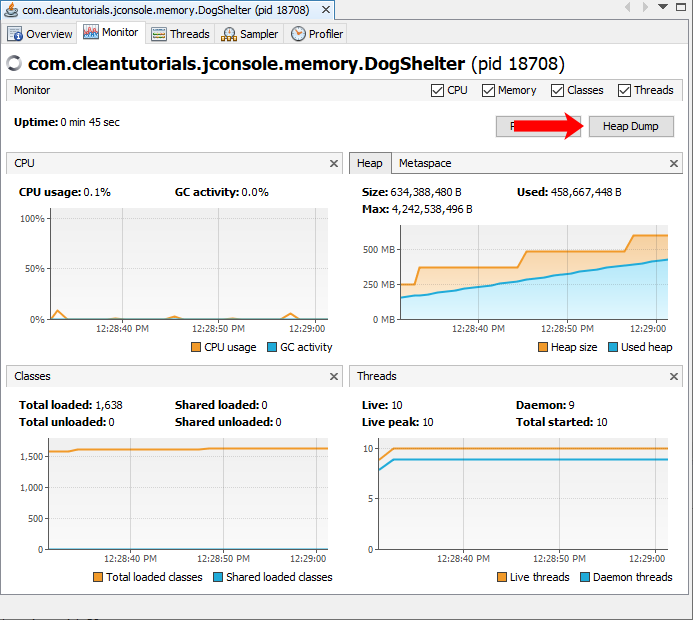
- After clicking on the heap dump you will be redirected to a new tab from which you can find out the location of your heap dump.
JConsole to generate the Heap dump
- Connect your application to JConsole.
- Switch to MBeans tab and select com.sun.management > HotSpotDiagnostic > Operations > dumpHeap.
- Before clicking on the dumpHeap function, set the parameters p0, p1 described below.
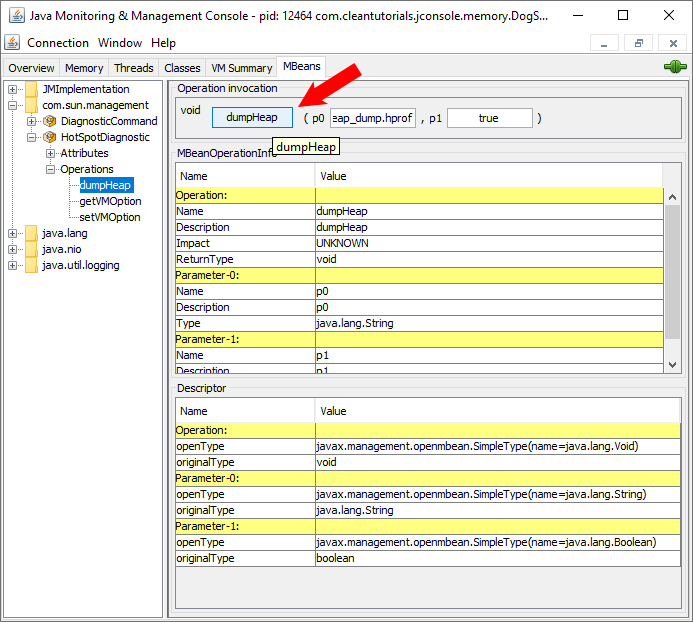
- The parameter p0 is the location and the name of the heap dump file. Ensure that you add the “.hprof” extension at the end of the file name.
- The parameter p1, if set to true, performs a GC before dumping the heap so that only live objects are present in the heap dump.
Which tools can be used to analyze the heap dump or open the .hprof file?
Once you have the heap dump the next step is to analyze it using a tool. There are multiple paid and equally good open source tools available to analyze the Heap dump. Memory Analyzer (MAT) is one of the best open-source tool that can be used as a plugin with Eclipse or as a standalone application if you don’t have Eclipse IDE installed. Apart from MAT, you can use Jhat, VisualVM. However, in this post, we will discuss the features provided with MAT.
Downloading the Memory Analyzer (MAT)
There are two ways to use the Memory Analyzer tool.
Integrating MAT plugin with Eclipse
- Open Eclipse IDE and select Help > Eclipse Marketplace.
- Search for Memory Analyzer and install it.
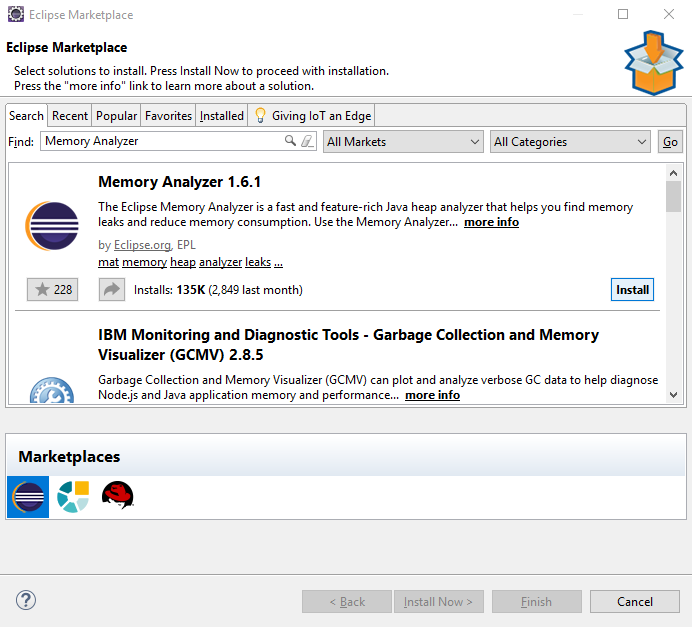
- Restart Eclipse and the plugin is ready to be used.
Downloading the standalone version of Eclipse MAT
- Download and install the Java Development Kit.
- Download the install standalone MAT application from this link.
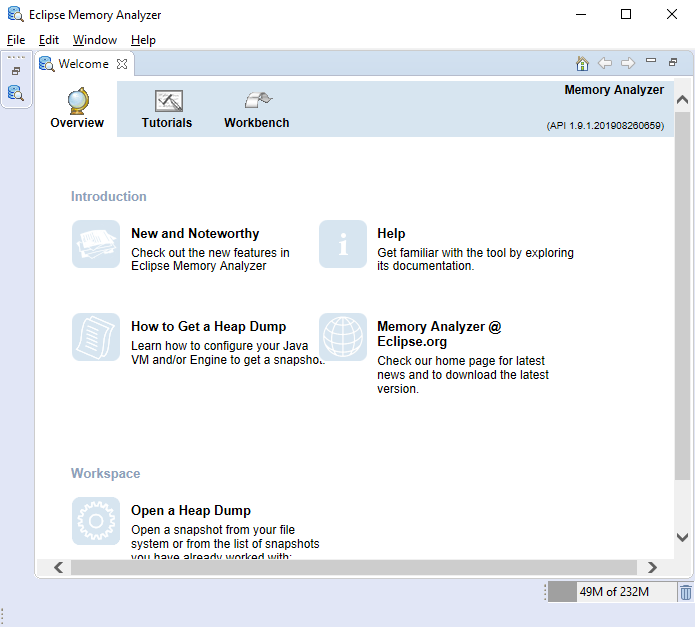
- After extracting the package open MemoryAnalyzer application to start using the standalone version of MAT.
Loading Heap dump file in Eclipse MAT
We will be analyzing the heap dump generated by this Java application. The memory leak in the application is discussed in depth in this tutorial. And the screenshots posted below are from the MAT plugin used with Eclipse IDE.
The steps to load the heap dump are as follows.
- Open Eclipse IDE or the standalone MAT Tool.
- From the toolbar, Select Files > Open File from the dropdown menu.
- Open the heap dump file with the extension .hprof and you should see the overview page as shown below.
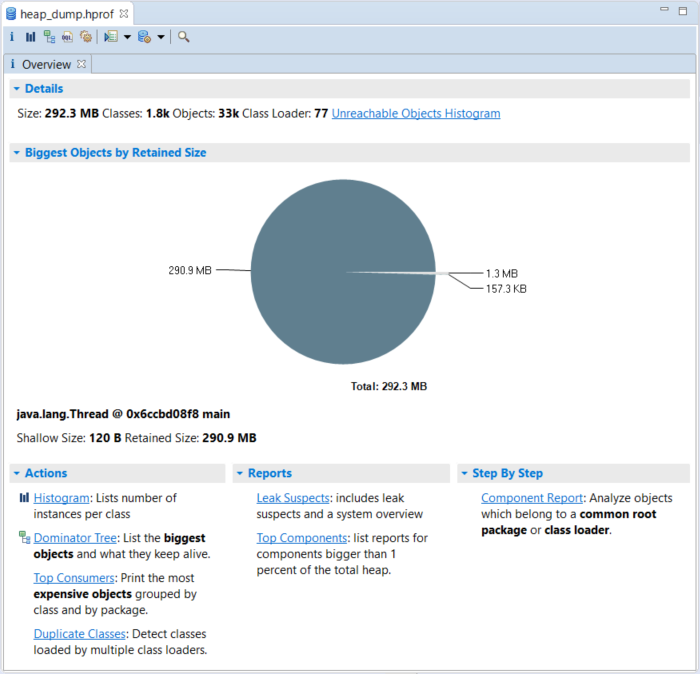
We will go through some of the important tools like Histogram, Dominator Tree and Leak Suspect report which can be used to identify memory leaks.
Histogram
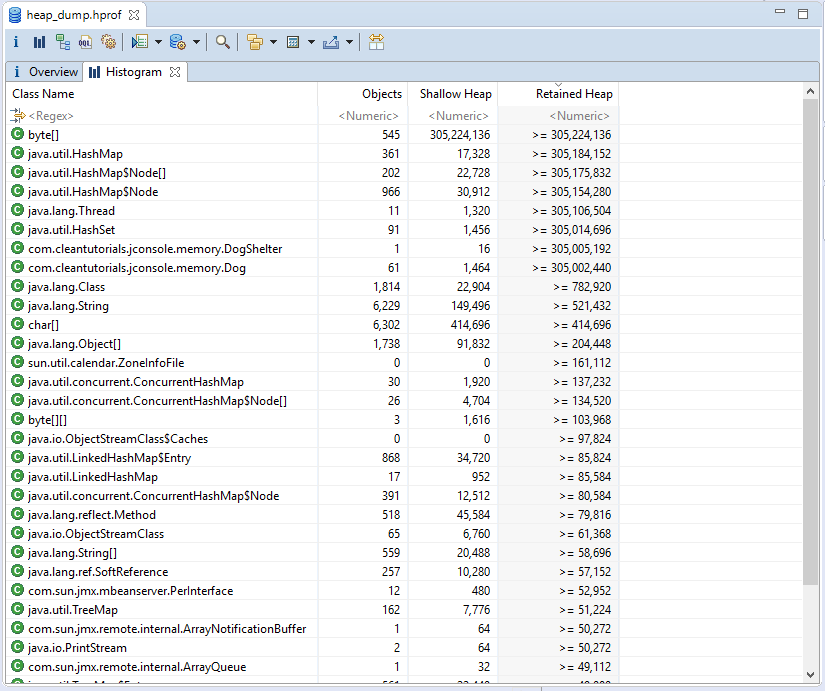
Histogram lists all the different classes loaded in your Java Application at the time of heap dump. It also lists the number of objects per class along with the shallow and retained heap size. Using the histogram, it is hard to identify which object is taking the most memory. However, we can easily identify which class type holds the largest amount of memory. For instance, in the screenshot below byte array holds the largest amount of memory. But, we cannot identify which object actually holds that byte array.
Shallow Heap v/s Retained Heap
Shallow Heap is the size of the object itself. For instance, in the screenshot below byte array itself holds the largest amount of memory. Retained Heap is the size of the object itself as well as the size of all the objects retained in it. For instance, in the screenshot below the DogShelter object itself holds a size of 16 bytes. However, it has a retained heap size of more than 305Mb which means it likely holds the byte array which contributes to the very large retained heap size.
Finally, from the Histogram, we infer that the problem suspect is byte[] which is retained by the object of class DogShelter or Dog.
Dominator Tree
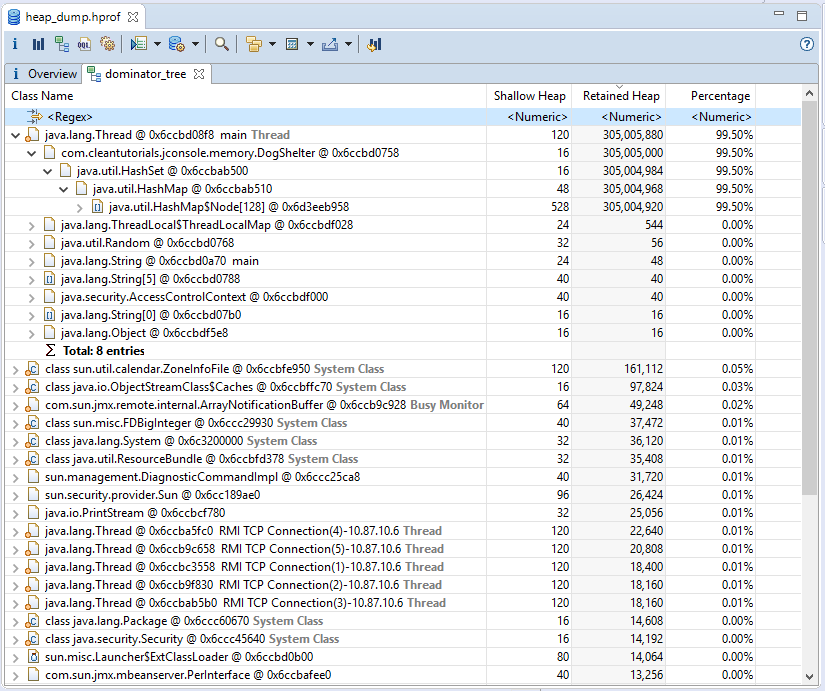
The dominator tree of the Java objects allows you to easily identify object holding the largest chunk of memory. For instance, we can see from the snipped below that the Main Thread object holds the largest memory. On collapsing the main thread tree we can see that the instance of class DogShelter holds a hashmap holding over 300Mb of memory.
Dominotart tree is useful when you have a single object that is eating up a large amount of memory. The Dominator tree wouldn’t make much sense if multiple small objects are leading to a memory leak. In that case, it would be better to use the Histogram to find out the instances of classes that consume the most amount of memory.
From the Dominator Tree, we infer that the problem suspect is the DogShelter class.
Duplicate Classes
The duplicate class tab will list down the classes that are loaded multiple times. If you are using ClassLoaders in your code you can use the Duplicate Classes to ensure that the code is functioning properly and classes are not loaded multiple times.
Leak Suspect
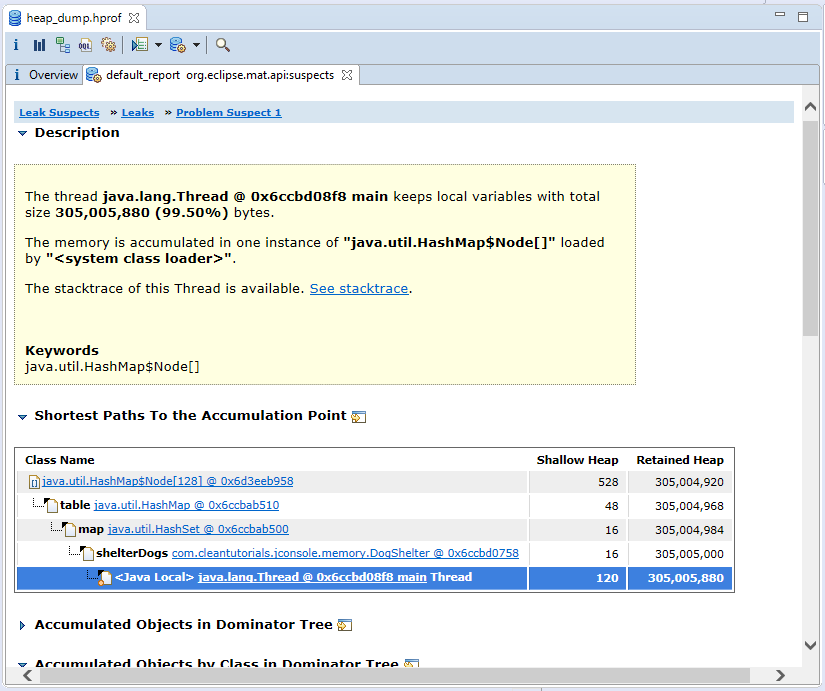
Finally, the Leak suspect report runs a leak suspect query that analyzes the Heap dump and tries to find the memory leak. For non-trivial memory leaks, the Leak suspect query may not be able to identify the memory leak and it’s up to the developer with the knowledge of the program to pinpoint the leak using the tools discussed above.
Since we had a very trivial memory leak, the inference that we derived manually using Histogram and Dominator Tree is the same as the inference from the leak suspect report as seen below.
