Deadlock Example and How to detect it using JConsole
In this post, we will see what a typical deadlock condition looks like by taking real-life examples as well as examples in Java. Later in the post, we will see the possible ways to detect and fix deadlock in Java Code.
Real-life Deadlock example
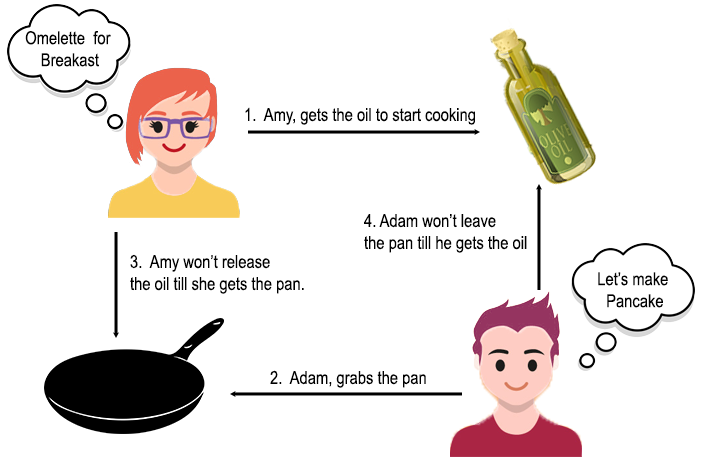
Let’s assume that Amy and Adam want to make breakfast, and both of them require a pan and oil (shared resource) for frying the raw ingredients that they own.
- Amy grabs the oil to start making her omelette.
- Adam grabs the pan to start making his Pancakes.
- Amy now wants the pan. However, Adam has the pan for now and won’t let go till he gets the oil.
- Adam now wants the oil. Amy is equally stubborn, she won’t let go of the oil till she gets the pan.
This is a deadlock situation where Amy and Adam have acquired a shared resource each and won’t let go of it until they get the other shared resource. Hence, Adam and Amy are stuck in a situation that can never be resolved.
Deadlock Example in Java
The deadlock example in Java is quite similar to the example we discussed above. Instead of Amy and Adam, we have Thread 1 and Thread 2 and instead of Pan and Oil, we have Object 1 and Object 2.
In the diagram below we can see the sequence of actions that will lead to a deadlock between two threads.
- Thread 1 acquires the lock on Object 1.
- Thread 2 acquires the lock on Object 2.
- Thread 1 attempts to acquire the lock on Object 2. However, it has to wait for the lock to be released by Thread 2.
- Thread 2 attempts to acquire the lock on Object 1. However, it has to wait for the lock to be released by Thread 1.
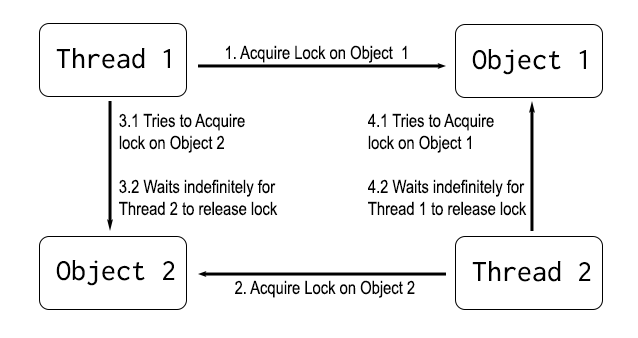
These sequences of actions will lead to a deadlock between Thread 1 and Thread 2 for the same reasons as we discussed above in the real-life deadlock example. The example Java code for creating this scenario is posted on Github.
What is Stack trace and how to read it?
To successfully detect a deadlock condition, it’s important to understand what the stack trace is and how to read an analyze it. The stack trace is the call stack i.e the list of methods that were called in order till the point of the current execution of the program.
Consider this very simple program.
| public class StackTraceExample { | |
| public static void main(String[] args) { | |
| StackTraceExample example = new StackTraceExample(); | |
| example.method1(); | |
| } | |
| public void method1() { | |
| method2(); | |
| } | |
| public void method2() { | |
| method3(); | |
| } | |
| public void method3() { | |
| try { | |
| Thread.sleep(500000); | |
| } catch (InterruptedException e) { | |
| e.printStackTrace(); | |
| } | |
| } | |
| } |
The methods are called in the following order.
- main method called my JVM
- method1
- method2
- method3
- sleep called in method3
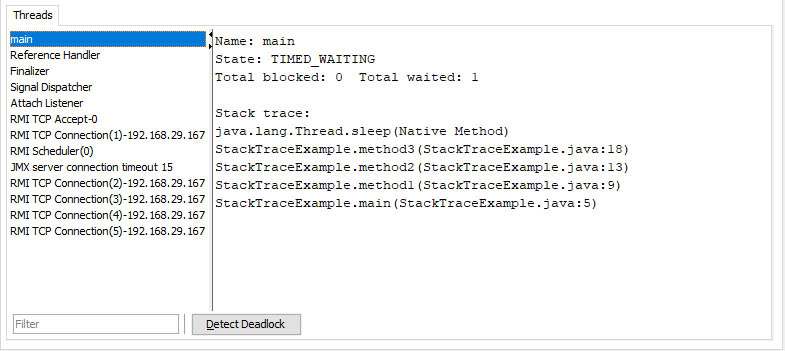
The stack data structure is LIFO so the method called last will be at the very top of the stack trace and the very first method will be at the bottom of the stack trace. In simple words, the list of methods will be reversed as seen below.
| Stack Trace of Main Thread from JConsole: | |
| java.lang.Thread.sleep(Native Method) | |
| StackTraceExample.method3(StackTraceExample.java:18) | |
| StackTraceExample.method2(StackTraceExample.java:13) | |
| StackTraceExample.method1(StackTraceExample.java:9) | |
| StackTraceExample.main(StackTraceExample.java:5) |
How to print stack trace in Java
To print the stack trace of all the threads in your Java application using the command-line interface you can follow these steps.
- Find out the process id/pid of the Java application using the command “jps”.
- To print the stack trace on the command line use the command “jstack <pid>”.
Note: To use the jps and jstack tool you need to have the Path Environment variable set to the bin folder of your JDK installation directory.
Reading Live stack trace of Threads using JConsole
Sometimes reading the live stack trace is more beneficial for debugging purposes as you could see the state of thread in the live program. To read the live stack trace you could use profilers like JConsole or JVisualVm. The steps for analyzing the stack trace using JConsole are as follows.
- Connect your Java process to JConsole.
- Open the Thread tab in JConsole and on the lower left section you will see the name of all the Live threads.
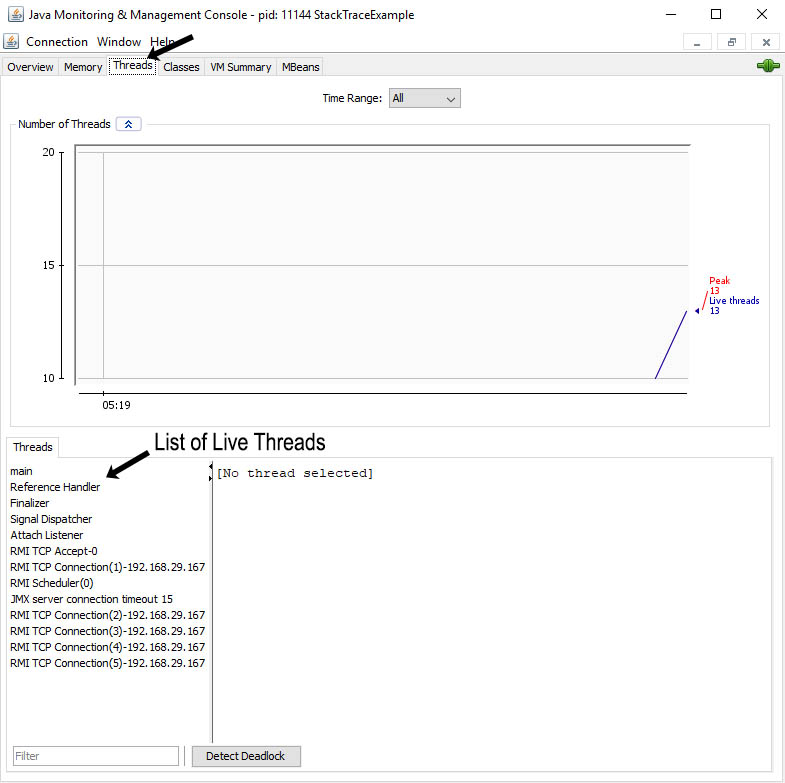
- Click on the thread name to get its live stack trace. The stack trace will automatically refresh with the latest changes.
Detecting deadlock using JConsole
JConsole can easily detect trivial deadlocks, like the one we discussed above with just a button click. The steps to detect deadlock using JConsole are as follows.
- Connect your Java Process to JConsole.
- Select the Thread Tab.
- Click on the “Detect Deadlock” button at the bottom right of the JConsole window.
- If JConsole is unable to find deadlock, a label with the text “No Deadlock Detected” will appear right next to the Detect Deadlock button. If there is a deadlock, a new tab will open with the thread in the deadlock condition.
Detecting deadlock by analyzing the Stack Trace
In large applications with multiple threads, detecting deadlock can be a difficult task. To detect non-trivial deadlocks we need to analyze the stack trace of all threads and try to find interdependencies between all the threads.
Let’s try to manually find a deadlock using the stack trace of the Java application discussed above.
From the stack trace of thread-0, we can analyze the following
- [Line 19] First, lock is acquired on the object with id “0x000000076bbe9648″/object 1.
- [Line 18] Then the thread attempts to acquire lock on object with id “0x000000076bbe9658/object 2”.
| "Thread-0" #11 prio=5 os_prio=0 tid=0x000000001d83f000 nid=0x7d24 waiting for monitor entry [0x000000001f4af000] | |
| java.lang.Thread.State: BLOCKED (on object monitor) | |
| at com.cleantutorials.jconsole.thread.DeadlockExample$1.run(DeadlockExample.java:24) | |
| - waiting to lock <0x000000076bbe9658> (a java.lang.Object) | |
| - locked <0x000000076bbe9648> (a java.lang.Object) | |
| at java.lang.Thread.run(Unknown Source) |
From the stack trace of thread-1, we can analyze the following
- [Line 12] First, Lock is acquired on the object with id “0x000000076bbe9658″/object 2.
- [Line 11] Then the thread attempts to acquire lock on object with id “0x000000076bbe9648″/object 1.
| "Thread-1" #12 prio=5 os_prio=0 tid=0x000000001d841800 nid=0x7ef4 waiting for monitor entry [0x000000001f5af000] | |
| java.lang.Thread.State: BLOCKED (on object monitor) | |
| at com.cleantutorials.jconsole.thread.DeadlockExample$2.run(DeadlockExample.java:40) | |
| - waiting to lock <0x000000076bbe9648> (a java.lang.Object) | |
| - locked <0x000000076bbe9658> (a java.lang.Object) | |
| at java.lang.Thread.run(Unknown Source) |
Thread-0 is waiting to lock Object 2 while holding the lock of Object 1 and thread-1 is waiting to lock Object 1 while holding the lock of Object 2 we have a deadlock condition. Hence, the two threads will remain in BLOCKED state forever.


