Find memory leak in your Java application using this quick JConsole hack
Let’s say you have an event that triggers an action that covers more than 5000 Lines of code and you suspect that it has a memory leak. It will be extremely challenging and time-consuming to go through all that code and try to determine if your code has a memory leak or not. However, using JConsole we can easily find if our Java Application has any major memory leaks using the following 4 steps.
- Run your Java application and connect JConsole to it. If you are unfamiliar with the steps you can refer to this tutorial.
- Repeat the action that you suspect has a memory leak. For instance, if you suspect that the action of adding an entry to the database has a possible memory leak then write a test script that would repeat the same action for a period of time in which you can detect a possible memory leak.
- Click on “Perform GC” at the top right of the JConsole window every few minutes. For instance, you could request to perform GC every single minute for 10 minutes while your action is continuously running in the background.

- Analyze the results as shown below to identify if your Java application has a memory leak or not.
Result Analysis
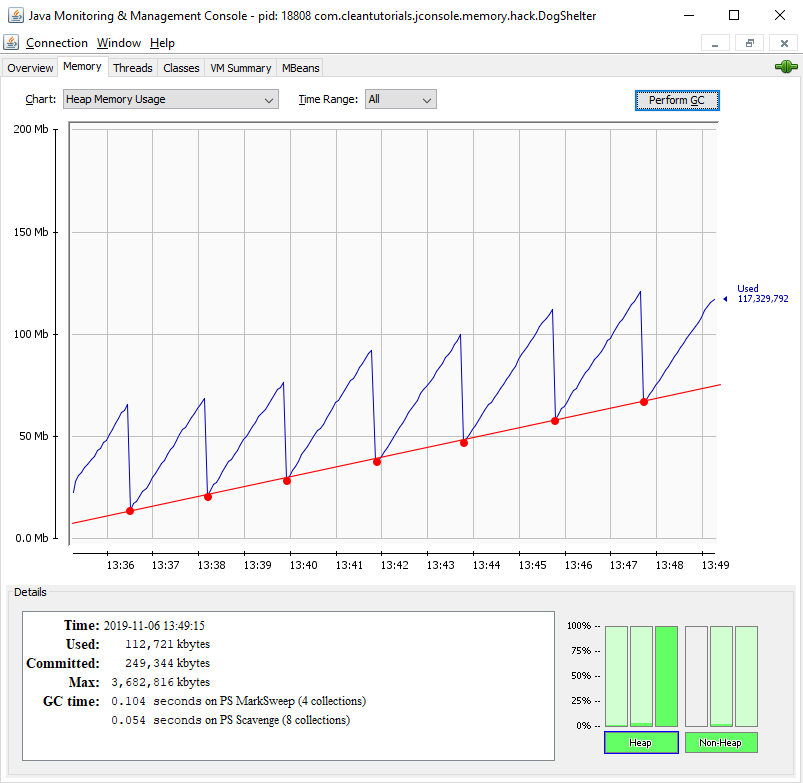
To analyze the results connect all the points just after GC operation finishes (from Step 3).
You have a memory leak if the connected line/curve is increasing or has a positive slope.
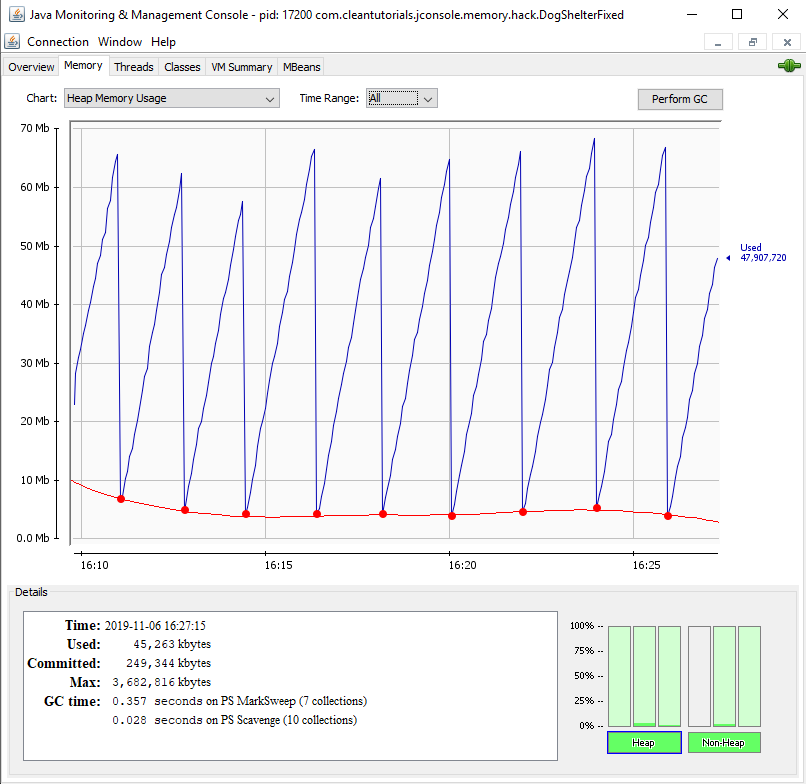
However, if the connected line/curve is non-increasing then you may not have a memory leak.
Assumptions
- It’s possible that after clicking Perform GC won’t actually trigger GC.
- Only the same action is repeated again and again. There is no other action being performed apart from the action that you suspect has a memory leak.
- The line in step 4 will increase in proportion to the size of the memory leak. If the memory leak is small then the curve will increase slowly. However, if the memory leak is big the line will increase with a greater slope. Therefore, if you have a memory leak in kilobytes then it may not be visible using this technique.


Comments