JConsole Tutorial

JConsole is a JMX (Java Management Extension) complaint monitoring and management tool. Using this tool a user can monitor a local or a remote Java process (having a connection with the machine on which JConsole is running). This monitoring tool also allows the user to perform a set of predefined operations on the JMX Agent i.e the Java process that is being monitored. For instance, during run time, if the user wants to fetch the value of a variable or the content of an array. The user can perform this operation using MBeans.
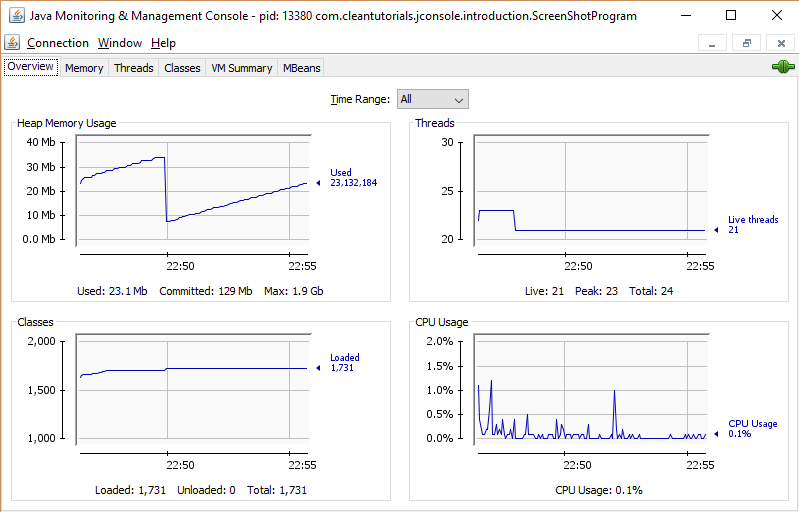
Various parameters such as memory, threads, CPU utilization among other essential attributes can be measured using J Console. Java Platform has built in support for profiling and monitoring Java Virtual Machine(JVM) using the JMX technology. Using this built in support you can not only monitor your stand alone applications but also web containers such as Apache Tomcat, JBoss etc.
About this tutorial
You will learn the following concepts after completion of this tutorial.
Memory Analysis.
- Checking for memory leaks.
- Taking a heap dump and analyzing the dump to find out the origin of the memory leak.
- Identify the different kinds of memory spaces in Java.
Thread Analysis.
- Taking a thread dump and analyzing it.
- Identifying possible deadlocks situations.
- Analyzing inter-thread communion.
CPU Utilization.
- Identifying CPU intensive processes.
- Studying peak CPU Utilization periods.
MBeans
- Performing operations on your application remotely, using MBeans.
- Creating a MBean object or resource.
You should have the basic knowledge of Java programming language since the tutorials contain multiple examples of Java Code.
Why should I use JConsole?
Using JConsole has the following advantages.
- It is free to use. You don’t need any license to use it commercially. Whereas other monitoring tools, such as JProfiler do require a license, if you want to use it commercially.
- Since almost all the machines have JDK (Java SE Development Kit) installed on them, there is no need to download JConsole separately as it is bundled along with the JDK.
- You can analyze small to medium scale applications using JConsole.
Using JConsole has the following disadvantages.
- There are other free tools such as JVisualvm which do not require any commercial license and provide with many other rich features apart from the one’s in JConsole.
- Monitoring of live application cannot be (It can be, but you shouldn’t) done using JConsole as it utilizes significant resources itself.
- Cannot be used during performance/load testing, as it will give results that are slightly above the normal values.
- Large scale applications are hard to monitor using this tool.
Even though JConsole lacks in the set of functionality that the other tools provide, it is important to first understand the basics of the monitoring tool. The basic understanding will help you in understanding the more complex features of other alternates such as JVisualVM.
To all the developers, please do share this tutorial on various social media platforms if you find it useful.


